Voronoys
Description
The Voronoys is a group formed by 4 statisticians and a political scientist. Its creation was motivated by the 1st Challenge of CEPESP Data of the FGV in which the group obtained the first place. The goal of the challenge was to decipher the elections in Brazil through analysis, visualization and data search tools. The name Voronoys comes from a mathematical technique called Voronoi Tessellation that was used in the analyzes proposed by the group.
Main aim
The idea of Voronoys is to provide a visualization tool different from conventional tools. For this, current and interactive visualizations were used. In addition, analysis differentials such as the use of data on donations to political parties and the study of coalitions between parties have been incorporated.
Another difference is the possibility of viewing the vote at a more disaggregated level than the municipality. For this purpose, the Voronoi tessellation technique was used to create regions around the electoral sections.
Visualizations
When entering the home page the user can choose three different types of views:
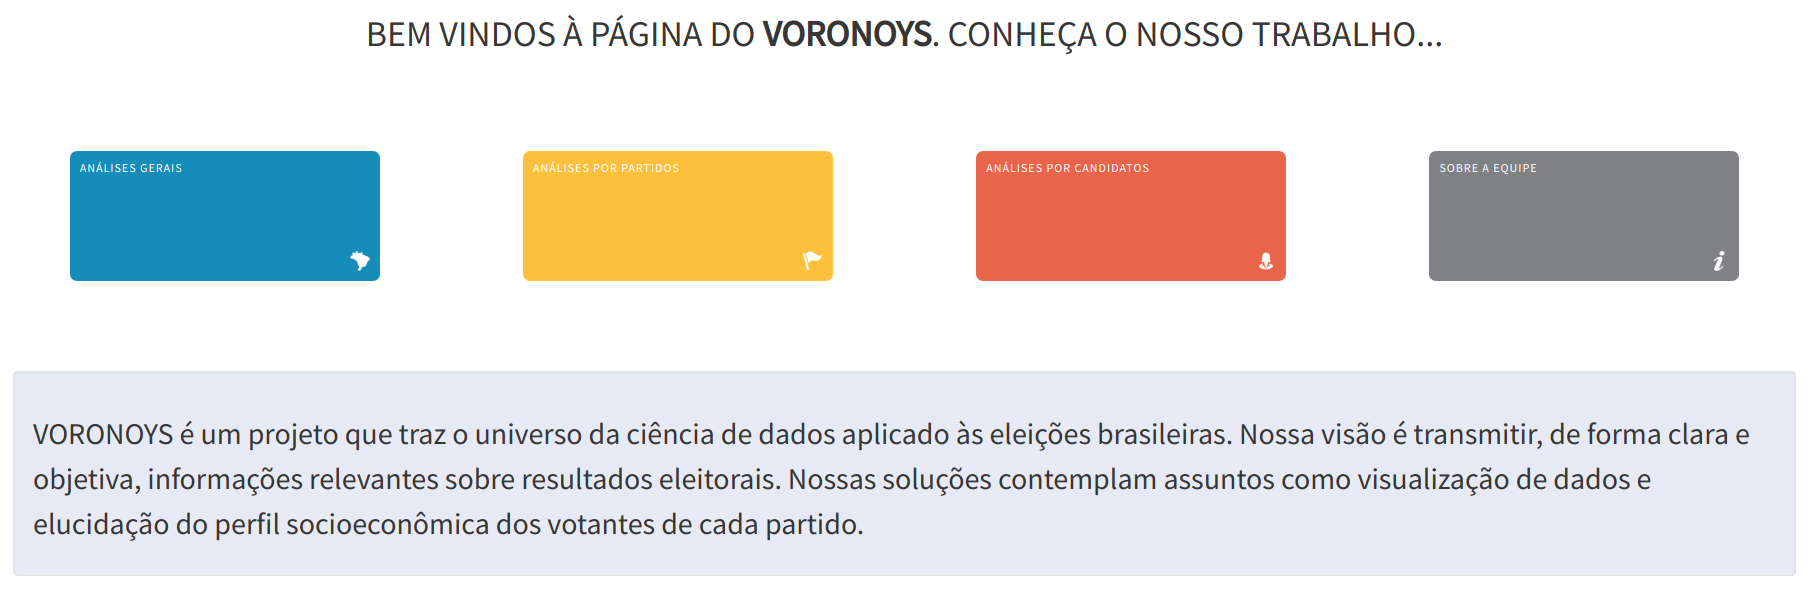
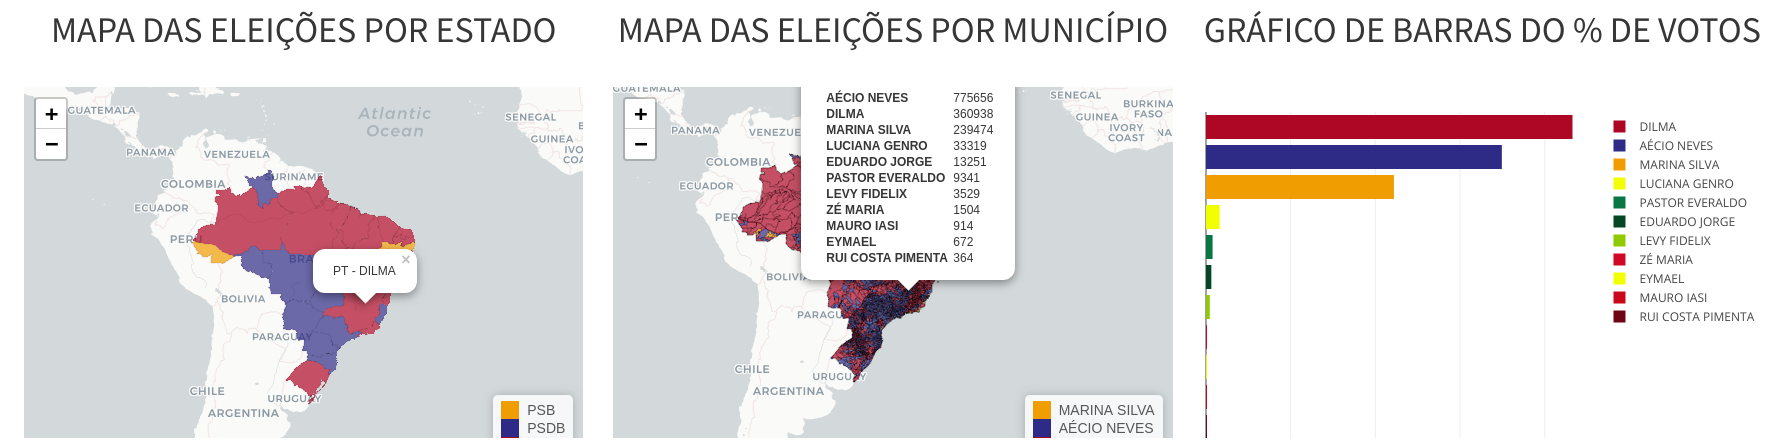
General elections
In this tab the user has access to the overall results of the elections:
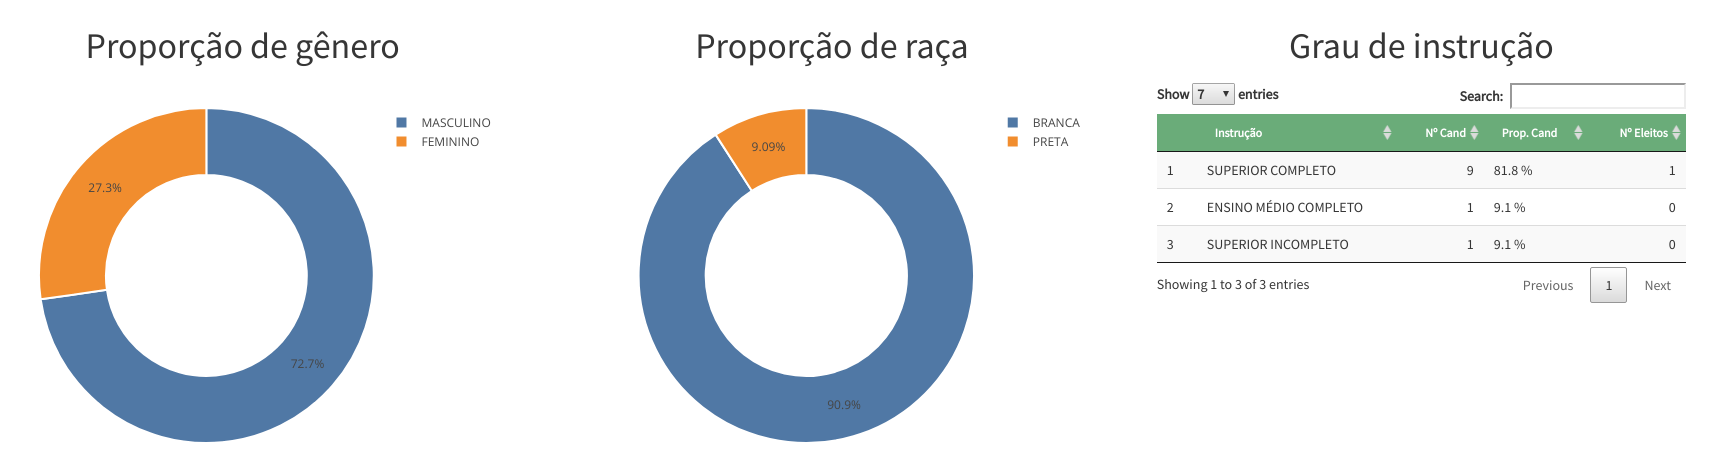
Political parties
In this tab the user finds various information about political parties:
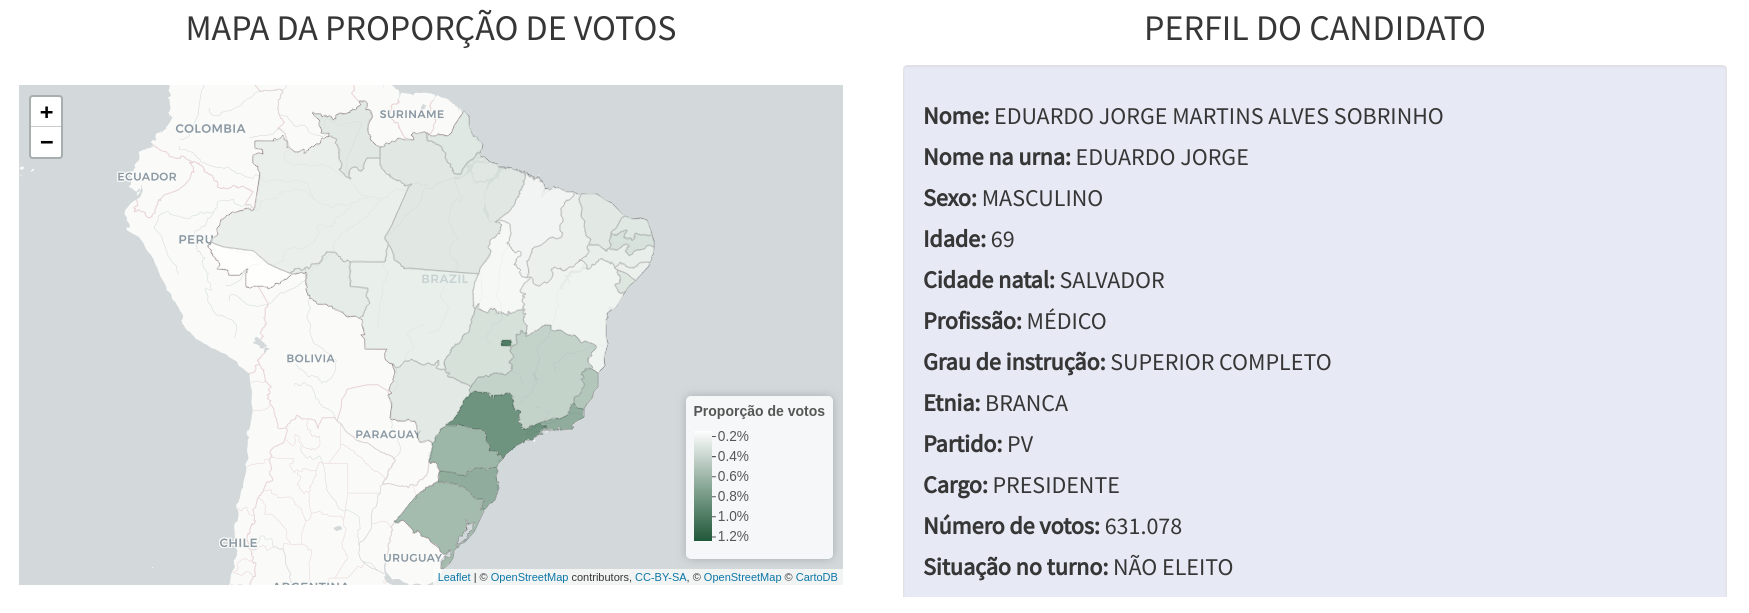
Candidates
In the ‘Perfil do candidato’ tab the user can see the voting map and the information of each of the candidates
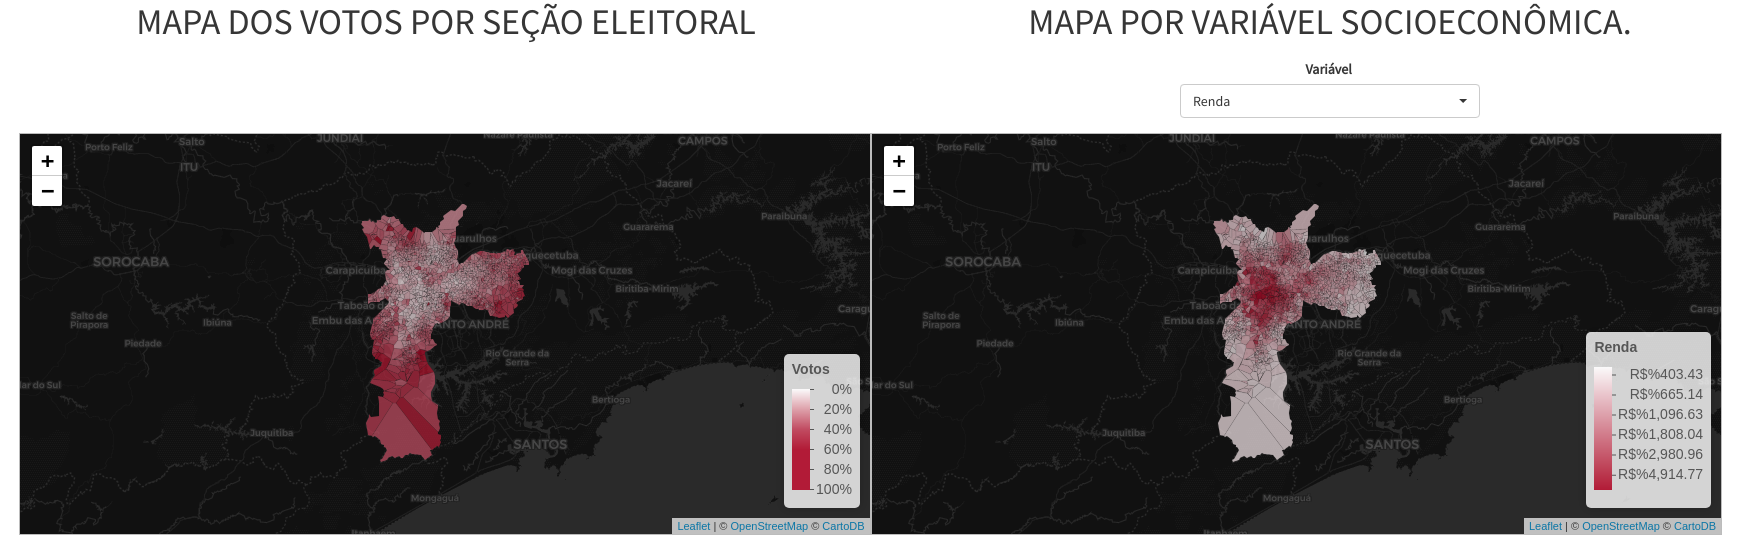
In the tab “Perfil do eleitorado” the user chooses a city and observes how each candidate was voted. In addition, it is possible to observe the income map of the regions of the city. For this visualization, the Voronoi tessellation technique was used. With this, we have a more granular view of the voting in each municipality besides being able to look for similar patterns between the votes and socioeconomic variables.
The application code is available on GitHub at the following address: https://github.com/voronoys/voronoys-app but the dataset is unfortunetely not available.